km-Scale Hackathon 2025
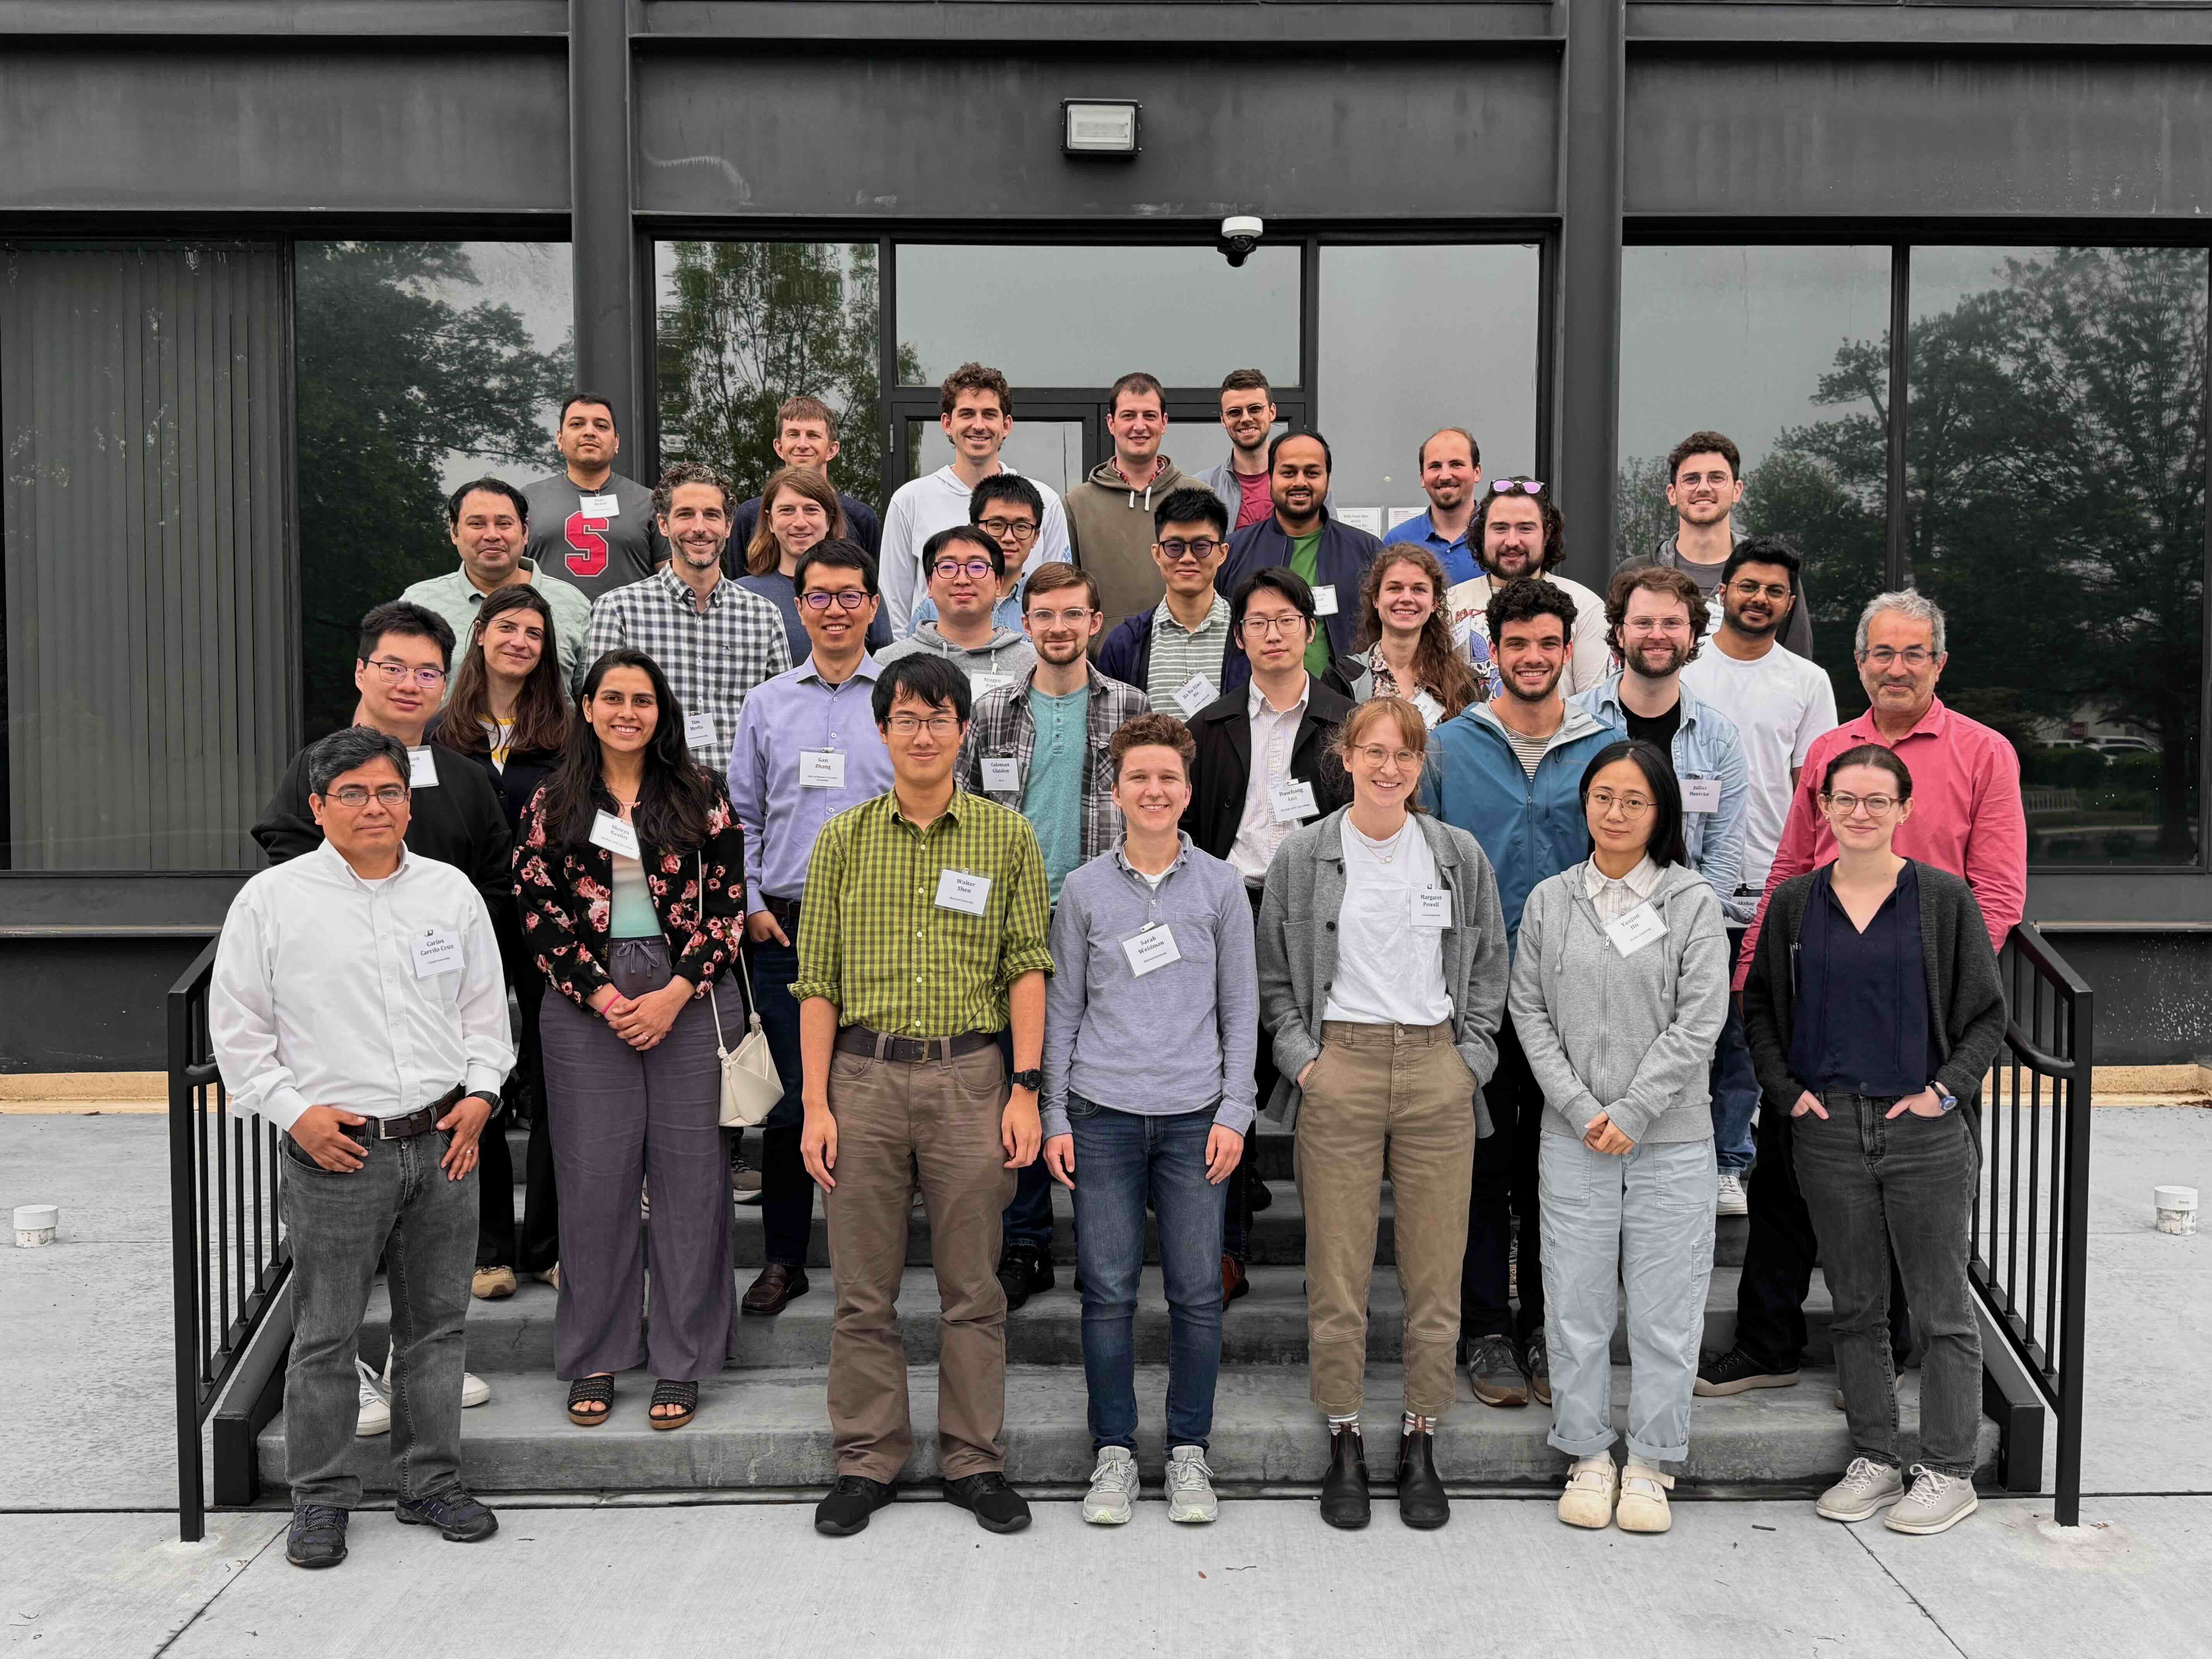
We just wrapped up the km-Scale Hackathon. I participated in the hackathon from the Princeton node, hosted at NOAA’s GFDL but the hacking was going on around the clock with teams distributed all around the world. The theme of the event was extremely highly resolved atmospheric simulations (below 1 km, some as high as 200m 🤯 ).
Most participants organized as part of teams focused on specific topics like clouds, hurricanes, extreme events, and many more. But naturally these simulations, and their enormous size, also posed unique technical challenges! So of course this immediately peaked my interest when I first heard about the event. Despite the ‘usual suspects’ of how to find, share, and process large datasets there was a focus on a specific grid type that was entirely new to me: HEALPix (Hierarchical Equal-Area and Isolatitude Pixelization)
HEALPix is a discrete global grid system (DGGS) that has some really interesting properties:
- It is hierarchical. The grid is uniquely defined by the level or zoom, and each cell of the grid can be recursively divided into a set of smaller cells (4 in th case of HEALPix), increasing the level (check out this visualization of the principle with H3, another hierarchical DGG).
- It is equal area. Each grid cell covers the same area on a sphere, avoiding singularities near the pole and making averages (global or regional) trivial.
- HEALPix also has the property that all longitude position of cell centers are aranged on constant latitude lines, which is advantageous for computing spherical harmonics, and also making longitudinal averages very simple to compute. you can read more about HEALpix here and here.
HEALPix has some very exciting prospects related to e.g.
- dynamic refinement of interactive maps
- being able to seamlessly prototype analysis on a lower zoom level and transition to high resolution for production
- eliminating complex weighted operations (and the errors associated with them)
- easy colocation of observational and simulation data (even though at the moment a lot of data has to be regridded to HEALPix first)
- and it seems that the above properties are also very helpful for ML/AI applications(see e.g. cBottle)
But the data is fundamentally served in a different shape than I am used to. Generally the data will have only a single spatial dimension that describes the unique cell identifier (in addition to e.g. a vertical level, time, etc).
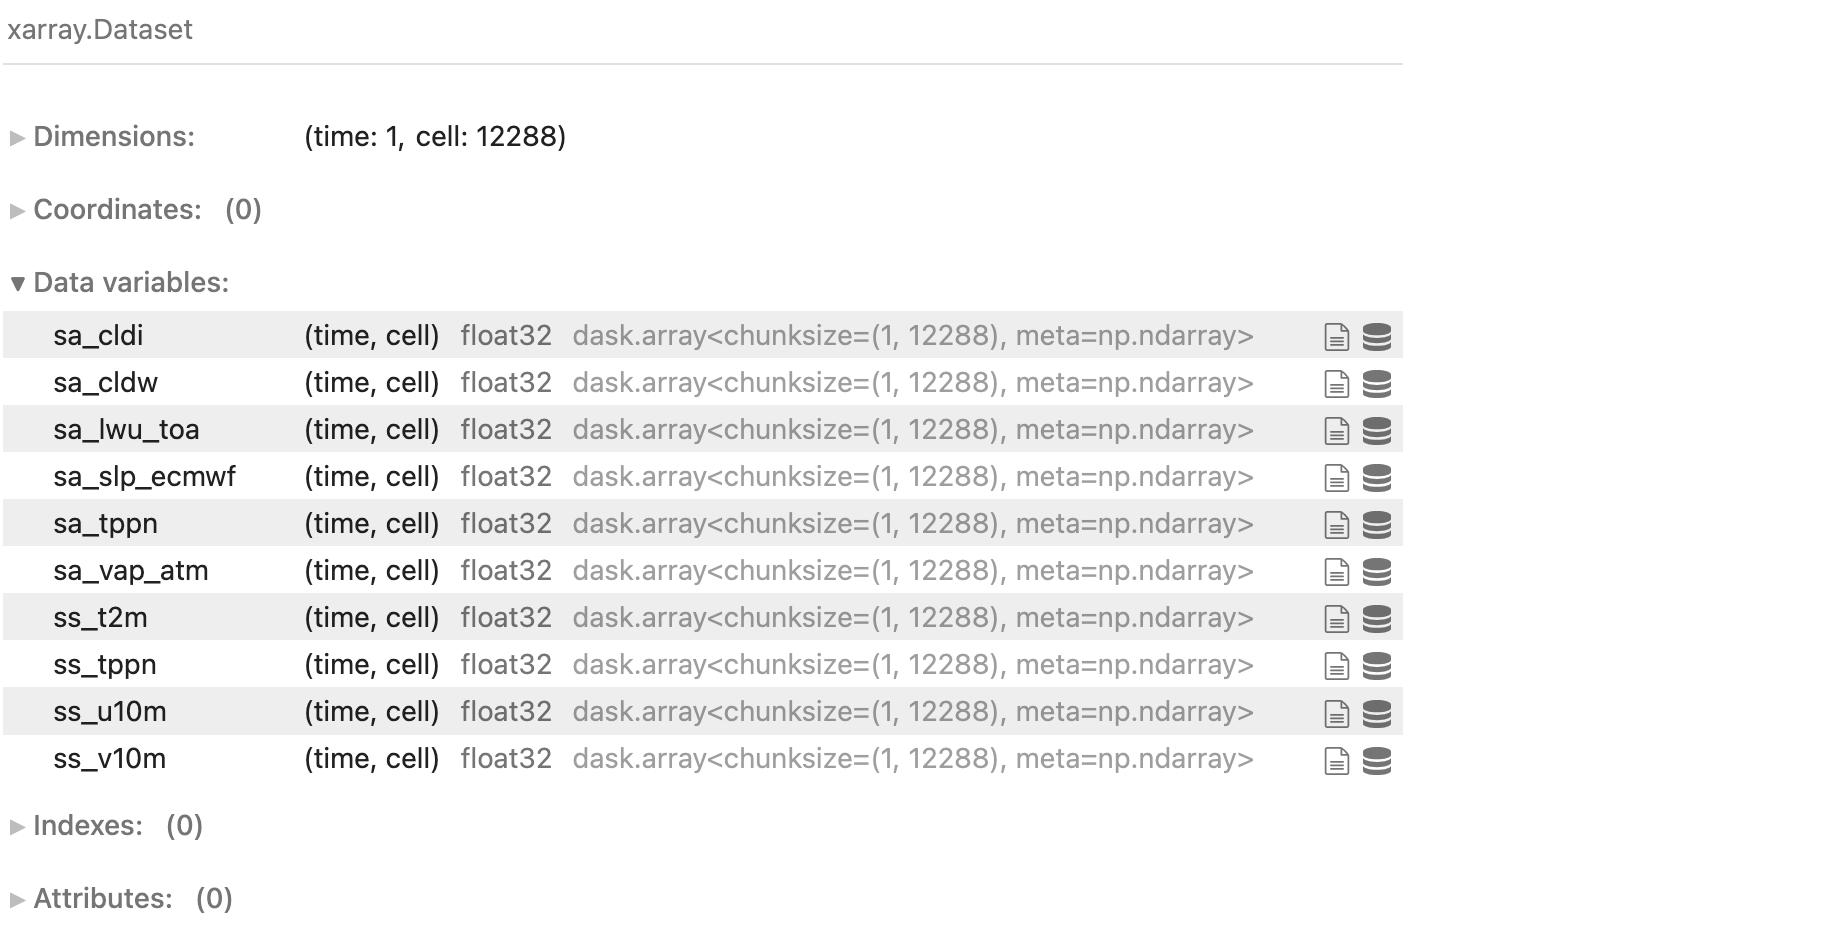
A low zoom level HEALPix dataset
To deal with this specific data organization, there are a bunch of different packages and a lot of helper function around (a great starting point is the awesome-HEALPix repo). But I became very curious about the xDGGS package. At its core, this package is an Xarray accessor that aims to abstract over not just HEALPix, but other DGGS as well. To be honest, one of the first things that hooked me was the fact that it enabled me to make an interactive lonboard plot within a few minutes - quick data exploration will never not get me. But the more I learned about DGGS by reading the excellent design document and talking to folks at the hackathon, the more I realized that implementing basic operations on the data (e.g. spatial subsetting, up/down scaling, convolution, calculus operators, …) in a way that can be exposed to users in a generalized interface for multiple DGGS is the right way forward. I am very impressed with the progress during the hackathon. We bumped into some issues with the xarray default behavior for dimension coordinates - remember that ~200m resolution I mentioned above, thats 12 billion cells 😳, loading those into memory did most definitely unalive my laptop immediately. But I am confident that these can be solved in a general way with some clever custom indicies. I definitely got enough of an overview to decide to stay involved in the xdggs-sphere” (🙄 something, something pun intended) and I am excited to see that project evolve! I wish I could have contributed more during the hackathon but towards the middle of the week I got pulled away into one of my personal favorites…making pretty videos…
It would be a crime not to visualize the living hell out of this data!
I mean LOOK AT IT!
I soooo want to see this on an 8k monitor…
But on a more serious note, I was not surprised, but still enjoyed all of the expert scientists discovering a bunch of interesting features in this video, and getting their head spinning with new ideas. Visualization is an essential part of creative and fast science!
Talking about fast, when I saw the stunning plot Tristan Abbott made for his paper, and then heard that we might have access to this super high time resolution data I could not stop myself from prototyping a movie until the very late night. I quickly realized that rendering out frames in serial with matplotlib’s FuncAnimate was not going to do the trick and I decided to finally follow Deepak Cherians advice to use streamjoy (the better alternative to my most unfortunately named python package to date). Once I figured out a little hack to have access to datasets with multiple variables more info , and was equipped with a nicely parallelized plotting, I was able to produce the first version of this together with Andrew Williams before lunch the next day (all that was needed was an unholy amount of fist bumps)!
As someone who always struggles to remember the api of matplotlibs colorbars, ticks, etc, I found that vibe-coding the changes I wanted with chatGPT was an unbelievable game changer. And I think the final video is nothing short of hypnotizing!
Science and coding is fun again
On a personal note, it was truly wonderful to be able to dive into messy complex issues again without the immediate anxiety that I felt right after resigning from Columbia. I was able to give 110% over a week, I could both progress on my own interests and help others out, and enjoyed every minute of it. I am tired as hell now, but I am also very happy. I will take a long weekend, because I have learned a lesson or two about burnout lately, but this event gave me the confidence to say that I am ready - and extremely excited - to go back to work.

Thanks
Let me close with a massive thanks to the organizers (Tim Merlin, Lucas Harris, Robert Pincus, and Anna Valerio). This was a very well organized event and while there where technical challenges - would be boring if not! - it felt like everyone was able to make progress in the room and there were some really nice science results to show at the end. I highly recommend anyone who is interested in this data to look out for upcoming events in this program!
Another round of special thanks to the xDGGS folks (Tina Odaka, Nick Hodgskin, Aart Stuurman, Justus Magin and Benoît Bovy), and Andrew Williams for wrangling the X-Shield data for the video. It was wonderful to meet so many new and familiar folks in Princeton.
Thanks everyone!